Google Cloud tackles applications performance monitoring [TechCrunch]

As Google builds out its cloud platform, it has been continually taking tools and services it has created in-house for its own team and putting them out in the world for its customers as products. Today, it added a key ingredient for developers building applications on the Google Cloud Platform when it announced a suite of application performance management tools called Stackdriver APM.
Google is doing something a bit different with its APM approach, designing it for developers to track issues in the applications they have built instead of passing that responsibility onto operations. The thinking is that the developers who built the applications and are closest to the code are therefore best suited to understand the signals coming from it.
StackDriver APM is made up of three main tools: Profiler, Trace and Debugger. Trace and Debugger have already been available, but by putting them together with Debugger, the three tools work together to identify, track and repair code issues.
“All of these tools work with code and applications that run on any cloud or even on-premises infrastructure, so no matter where you run your application, you now have a consistent, accessible APM toolkit to monitor and manage the performance of your applications,” Morgan McLean, Product Manager at Google wrote in a blog post announcing Stackdriver APM.
When you put this together with Stackdriver Monitoring and logging tools, you have a full APM suite that could potentially compete with a number of vendors from Splunk to Datadog to New Relic and AppDynamics (now owned by Cisco). But Sam Ramji, VP of product management at Google says these vendors are partners as much as competitors, and they see these tools all working together to help teams track down code issue.
“We are doing a better job at making core systems visible to everybody. People will continue to use tools they favor to know how production systems are doing and have alerting systems in place for the objectives for their business,” he said.
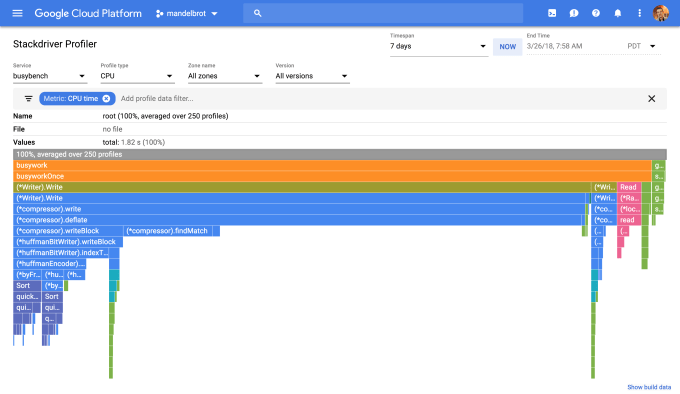
It all starts with The Profiler, which McLean writes, lets developers collects data via lightweight sampling-based instrumentation that runs across all of their application’s instances.

Stackdriver Profiler. Image: Google
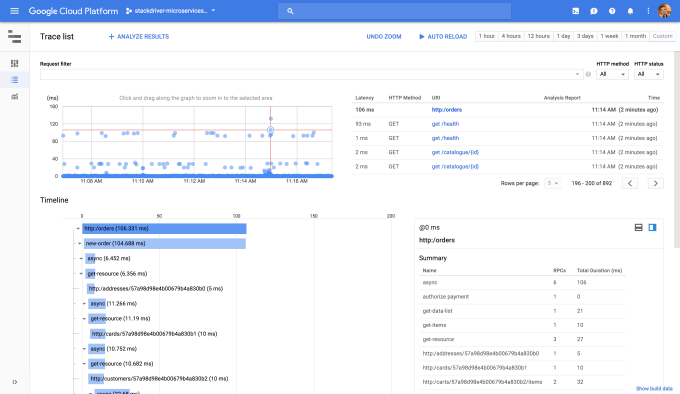
Once the programmer sees a problem, that’s where Trace comes in. Ramji says that code issues almost always follow a critical path, and they can use this tool to understand how the problem propagates across distributed systems. They do this in the form of visual analytics that really illustrate the nature of the problem and the impact it’s having on compute resources.

Stackdriver Trace tool. Image: Google
Finally, there is Debugger, a piece that Ramji is particularly fond of because it reminds him of tools in the 90s, when could stop and start an application to see where issues were happening with your compute resources. This tool provides similar functionality in a modern context, letting developers stop code at certain points to help identify the core issues affecting the code.
What’s really remarkable about this process, what Ramji calls “the magic” is that it enables developers to start and stop the code without affecting the customer. As McLean wrote, it gives programmers “a familiar breakpoint-style debugging process for production applications, with no negative customer impact.”
Stackdriver APM is available today and it provides a full-service monitoring suite. Whether Google intends to compete with some of the other players in this space or not, that would seem to be the end result.
Source: TechCrunch https://techcrunch.com/2018/03/28/google-cloud-tackles-applications-performance-monitoring/

Post a Comment